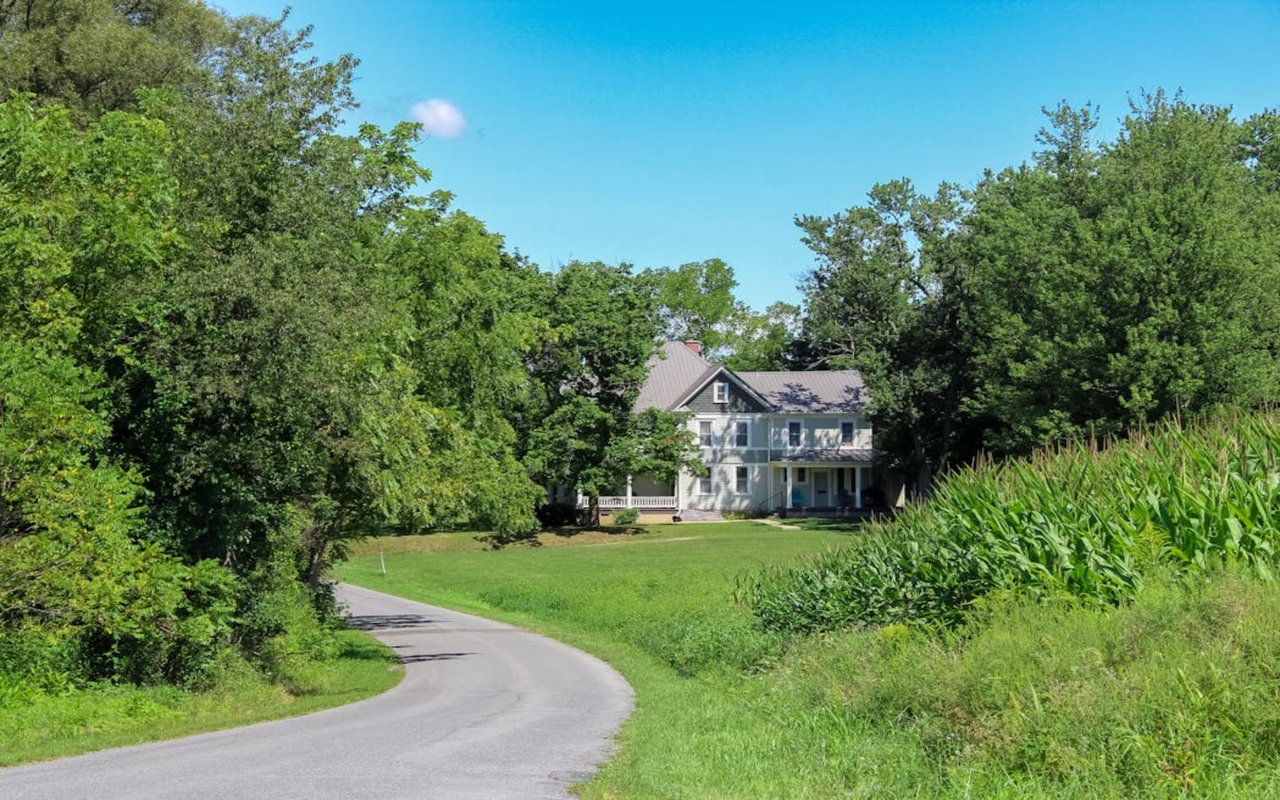
Welcome to
Accident
The national median home value is $308,980. The average price of homes sold in here is $240,000.
The median home value in Accident, MD is $240,000. This is lower than the county median home value of $299,900. The national median home value is $308,980. The average price of homes sold in Accident, MD is $240,000. Approximately 59% of Accident homes are owned, compared to 19% rented, while 21% are vacant.
Accident real estate listings include condos, townhomes, and single family homes for sale. Commercial properties are also available. If you like to see a property, contact Accident real estate agent to arrange a tour today!
2,327 people live in Accident, where the median age is 39.4 and the average individual income is $41,376. Data provided by the U.S. Census Bureau.
Total Population
Median Age
Population Density
Average individual Income
There's plenty to do around Accident, including shopping, dining, nightlife, parks, and more. Data provided by Walk Score and Yelp.
Explore popular things to do in the area, including Branch Bender Cidery, Harvest House, and Firefly Farms.
| Name | Category | Distance | Reviews |
Ratings by
Yelp
|
|---|---|---|---|---|
| Dining | 3.65 miles | 16 reviews | 5/5 stars | |
| Dining | 4.79 miles | 7 reviews | 5/5 stars | |
| Dining · $$ | 1.09 miles | 65 reviews | 4.8/5 stars | |
| Dining | 4.29 miles | 4 reviews | 5/5 stars | |
| Beauty | 4.6 miles | 16 reviews | 4.7/5 stars | |
|
|
||||
|
|
||||
|
|
||||
|
|
||||
|
|
||||
|
|
Accident has 847 households, with an average household size of 2.5. Data provided by the U.S. Census Bureau. Here’s what the people living in Accident do for work — and how long it takes them to get there. Data provided by the U.S. Census Bureau. 2,327 people call Accident home. The population density is 41 and the largest age group is Data provided by the U.S. Census Bureau.
Total Population
Population Density Population Density This is the number of people per square mile in a neighborhood.
Median Age
Men vs Women
Population by Age Group
0-9 Years
10-17 Years
18-24 Years
25-64 Years
65-74 Years
75+ Years
Education Level
Total Households
Average Household Size
Average individual Income
Households with Children
With Children:
Without Children:
Blue vs White Collar Workers
Blue Collar:
White Collar:

8309 Greensboro Dr, Ste 225 McLean VA 22102
8309 Greensboro Dr, Ste 225 McLean VA 22102